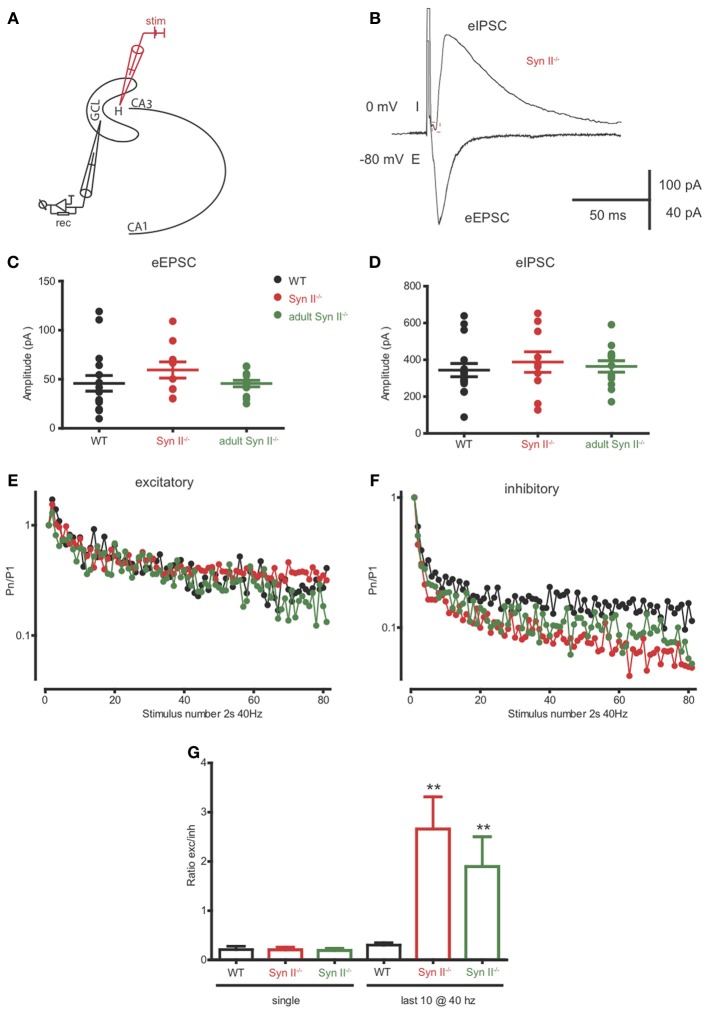
Figure 7.
The inhibitory output of hilar mossy cells to granule cells is reduced in both pre-symptomatic and symptomatic Syn II−/− mice. (A) Scheme of the experimental setup. (B) Representative traces of an eEPSC (−80 mV, inward) and an eIPSC (0 mV, outward) recorded in the voltage-clamp configuration from the same pre-symptomatic Syn II−/− granule cell after the stimulation of the perforant path. (C,D) Aligned dot-plots representing the amplitude of the eEPSCs (C) or eIPSCs (D) from young WT (black), pre-symptomatic (red) and symptomatic (green) Syn II−/− mice. (E,F) Plots of the normalized mean amplitude of excitatory (E) or inhibitory (F) responses vs. time showing the multiple-pulse depression during a 2-s train at 40 Hz in young WT (black), pre-symptomatic (red) and symptomatic (green) Syn II−/− mice. (G) Mean (±s.e.m.) ratio between the amplitudes of eEPSCs and eIPSCs from the same granule neurons (young WT, black; pre-symptomatic Syn II−/−, red; symptomatic Syn II−/−, green) in the case of a single stimulus (left) or for the last 10 stimuli in a 40 Hz train (right); **p < 0.001, Kruskal–Wallis test followed by Dunn's multiple comparison test.

