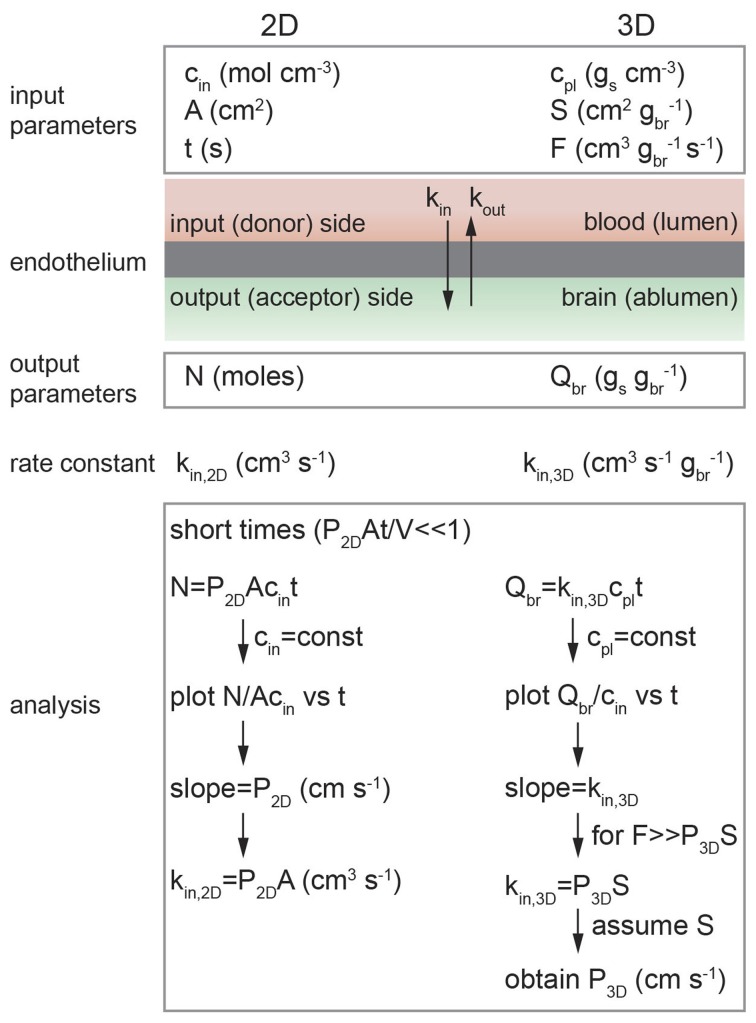
Figure 5.
Schematic illustration of analysis of diffusion transport in 2D and 3D. In 2D: cin is the solute concentration on the input side in a transwell assay, A is the area of the cell monolayer (cm2), N is the number of moles of solute measured on the output side in volume V (cm3), and kin, 2D is the 2D rate constant (cm3 s−1). As long as cin = constant then kin, 2D = P2DA. In 3D: cpl is the solute concentration in plasma (gs cm−3), S is the normalized surface area of the lumen (cm2 gbr−1), and F is the normalized flow rate (cm3 gbr−1 s−1), Qbr is the amount of solute transported to the brain (gs gbr−1), and kin, 3D is the 3D rate constant (cm s−1 gbr−1).

