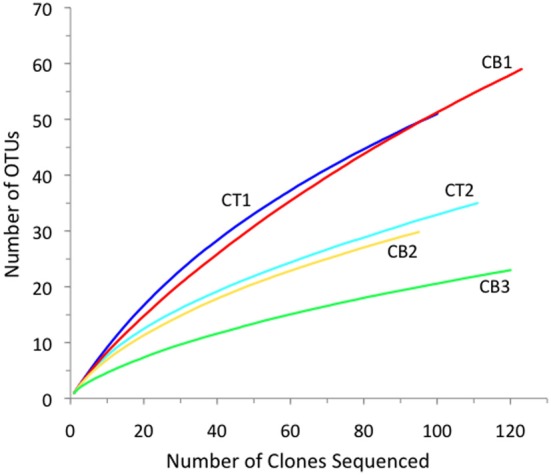
Figure 4.

Rarefaction curves displaying observed OTU richness versus the number of nirS clones sequenced from each of five Chesapeake Bay sediment samples. OTUs were defined according to 5% nucleotide sequence difference using the furthest neighbor method.
