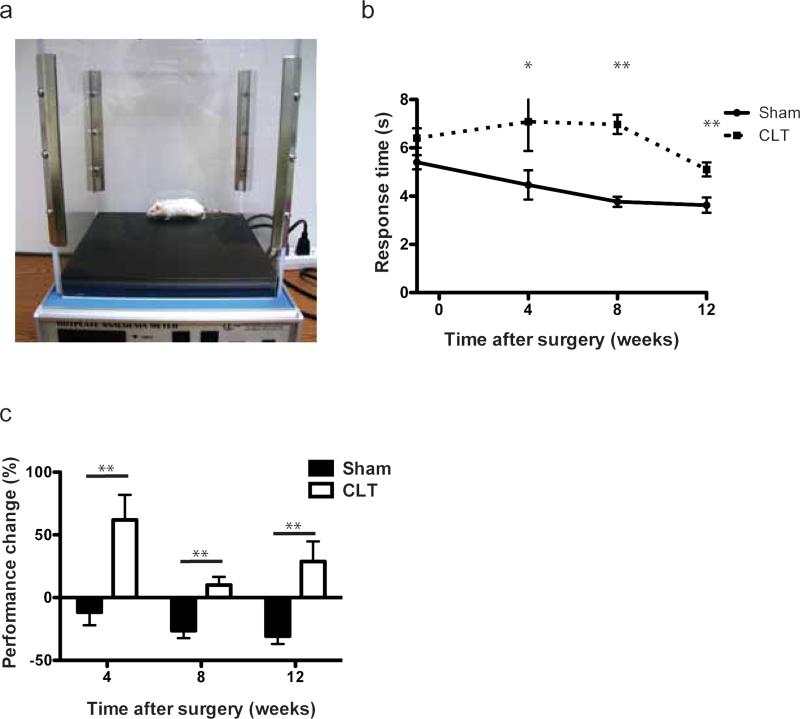
Fig. 2. Pain sensitivity and mobility measured by hotplate analysis.
(a) Experiment setup and device of hotplate analysis; (b) Response time of the mice before and at different time points after surgery; (c) Performance change on hotplate normalized to individual mice. Performance change = [(time after – time before)/ time before] × 100%. N=12-14. All error bars represent s.e.m. *p<0.05, **p<0.01.

