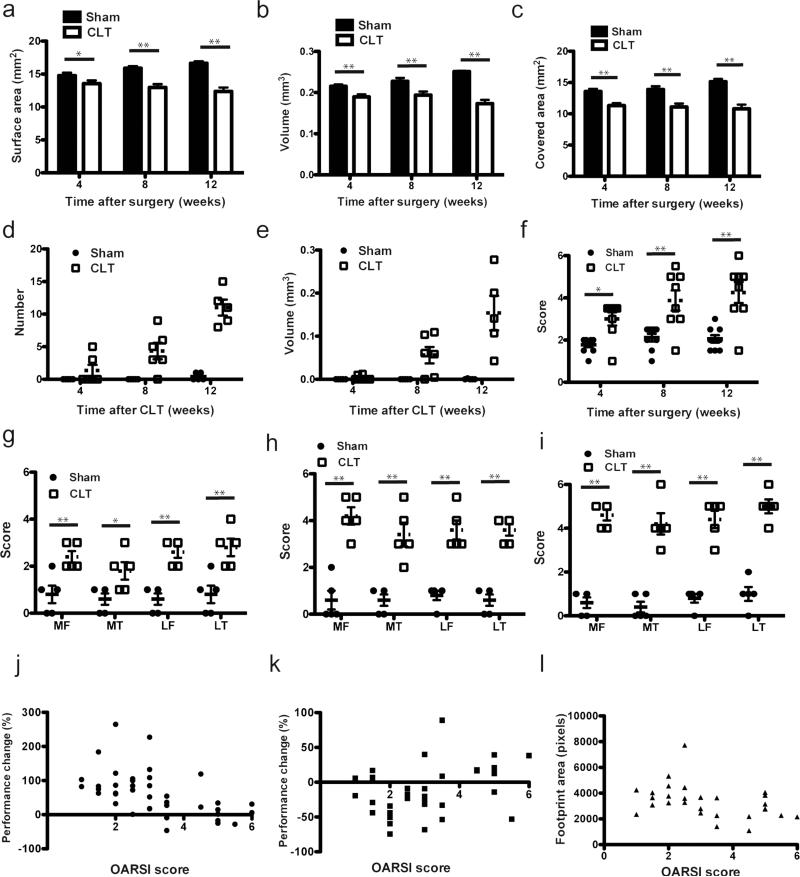
Fig. 6. Longitudinal evaluation of cartilage loss and pathological changes in CLT mice.
(a) Cartilage surface area, (b) Cartilage volume (c) subchondral bone area covered by cartilage (d) osteophyte number and (e) osteophyte volume in whole hind limb knee joint in mice at different time points after surgery, N=5-6; (f) Maximum OARSI score on sham and CLT whole hind limb joints in mice at different time points after surgery, N=8. (g-i) Synovitis score at 4 weeks (g), 8 weeks (h) and 12 weeks (i) post surgery at medial femur (MF), medial tibia (MT), lateral femur (LF) and lateral tibia (LT), N=5. (j-l) Bivariate correlation between OARSI score and performance changes in rotarod analysis (Spearman rho=−0.6024, p<0.0001, n=39) (j), hotplate analysis (Spearman rho =0.3585, p<0.05, n=34) (k) and hind limb foot print area (Spearman rho=−0.4586, p<0.05, n=29) (l) All error bars represent s.e.m. *p<0.05, **p<0.01.

