Fig. 5.
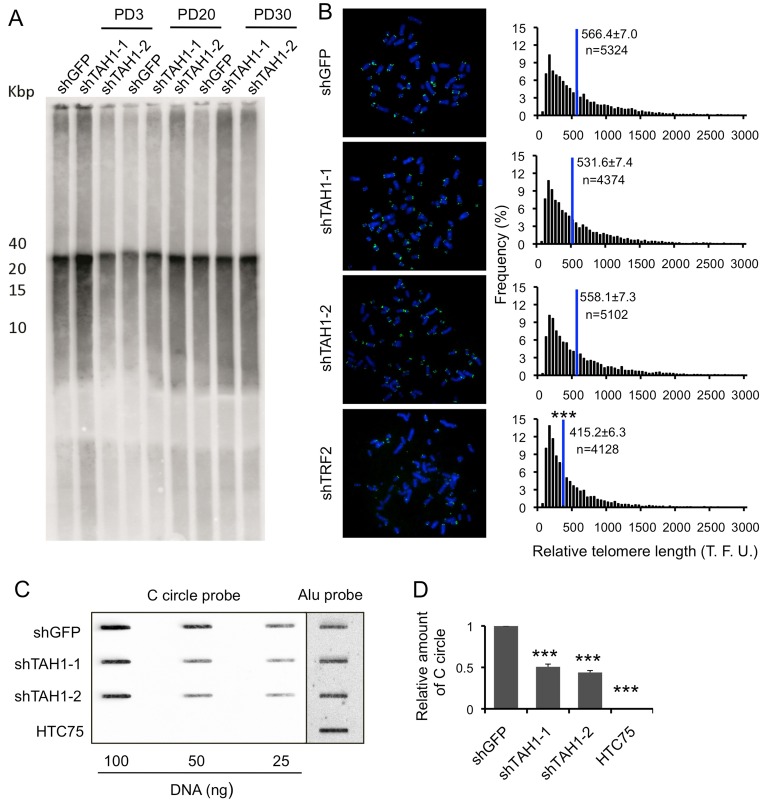
TAH1 contributes to ALT activity. (A) Telomere restriction fragment (TRF) analysis of control U2OS cells and those expressing shRNA sequences against TAH1. PD, population doubling. (B) Q-FISH analysis of control U2OS cells and those expressing shRNA sequences against TAH1. TRF2 knockdown cells were used as positive controls. Histograms show the distribution of relative telomere length expressed as fluorescence intensity (TFU, telomere fluorescence unit), and blue lines mark the mean. n indicates the number of telomere signals. Error bars indicate standard errors. ***P<0.001 compared with control. (C) Various amounts of genomic DNA from control and TAH1 knockdown U2OS cells was used for the CC assay. HTC75 cells were used as negative control. (D) Quantification of data from C. Intensity values from TAH1 knockdown cells were normalized to control cells for individual DNA concentration. The values were then combined and averaged for each cell line to determine the relative C-circle formation activity. Error bars indicate standard errors (n = 3). ***P<0.001 compared with control.

