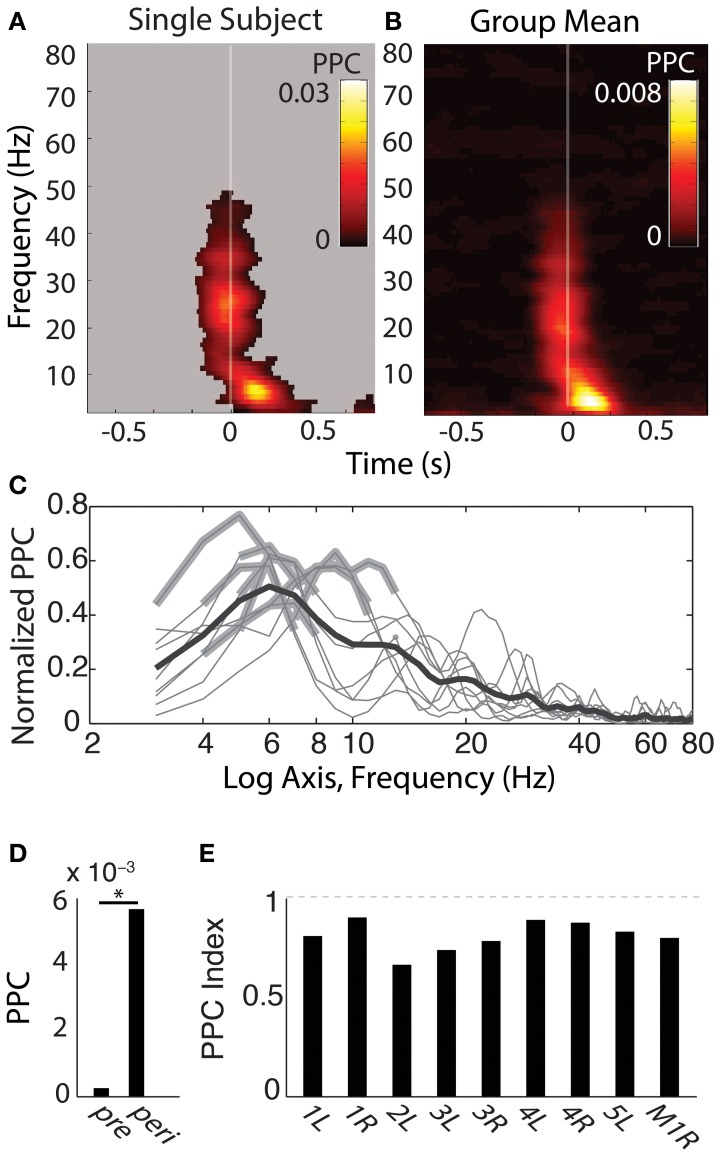
Figure 4.
Phase-alignment to fixations during search shows specificity in frequency and time. (A) Single-subject theta-band phase-locking to fixations. Shown is the pairwise phase consistency (PPC) for each time-frequency bin described in Figure 3, with time on the x axis relative to fixation onset and frequency on the y-axis. Significant PPC values are unmasked (p < 0.001 of fixation-time-shuffled distribution and Rayleigh test p < 0.001 FDR corrected). (B) Group-averaged PPC plots for each hippocampus sampled. Conventions are as in (A), but for the mean PPC values, with no masking. (C) Frequency band-limited hippocampal phase alignment to fixations, across subjects. For each frequency indicated on the x axis, the y-axis shows the mean PPC value from time-frequency points centered −50 to 250 ms from fixation onset, expressed as the proportion of the maximal PPC value of that sample from 3 to 80 Hz and −800 to 800 ms. Each thin line reflects the normalized PPC from a single hippocampus, with significant frequency bands indicated with a thickened gray line; all hippocampi produced significant phase concentration within a 3–8 Hz band; none produced significant phase concentration above 12 Hz. The black bold line is the group-averaged mean (N = 9). (D) Peri-fixational phase alignment, group averages pre and peri-fixation. Average PPC values from time bins centered −50 to 250 ms from fixation onset were compared with PPC values −800 to −600 ms prior to each fixation. *p < 0.01, Wilcoxon signed rank test. (E) Bars reflect the PPC values from each hippocampus recorded, indexed as the difference between the pre- and peri-fixational time windows (see Materials and Methods). Participant number and hemisphere are indicated below each bar.

