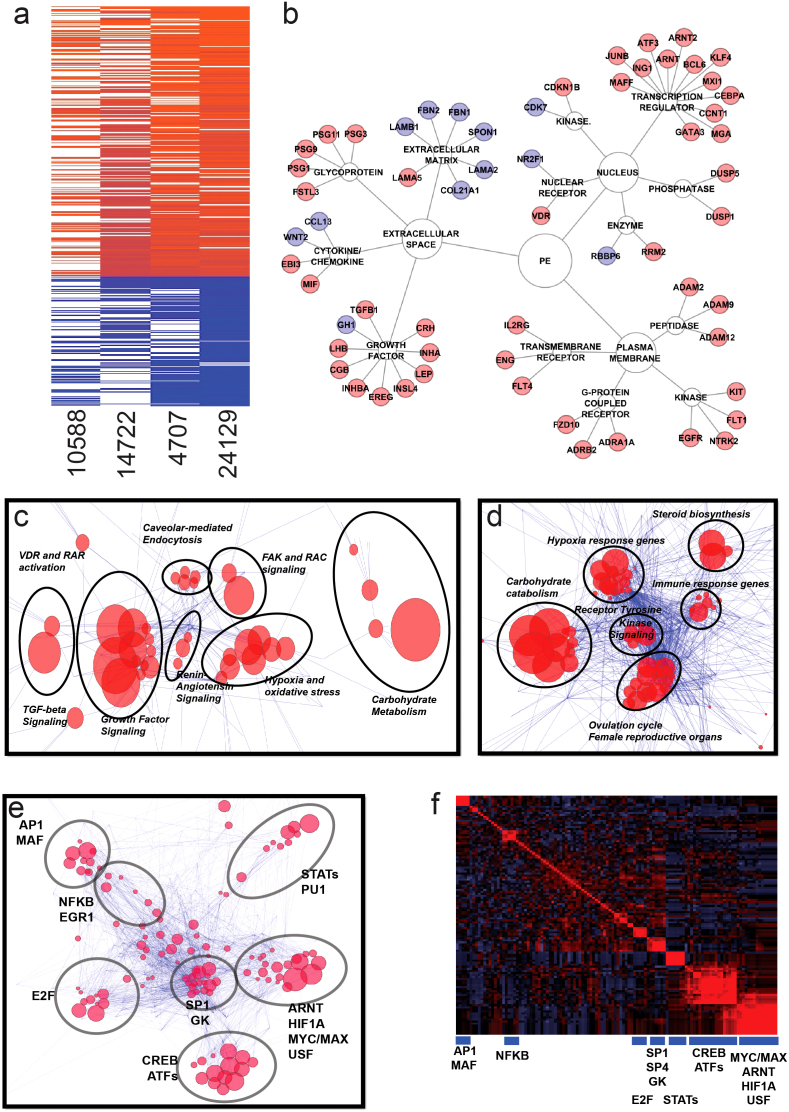
Figure 1. Identification of preeclampsia-associated genes.
Panel (a). Meta-analysis of four datasets (GSE1058819, GSE1472220, GSE470721, and GSE 2412922) using Fisher's combined probability test. Genes found significant in at least two of four datasets and having the same direction of the fold change were considered for further analysis. Panel (b). Selected representative genes found significant in the meta-analysis grouped based on the type of encoded protein. Upregulated and downregulated genes are marked by red and blue color, respectively. Panel (c). Canonical pathway analysis through the use of IPA (Ingenuity® Systems, www.ingenuity.com) depicting reconstructed pathways containing majority of differentially-regulated genes in preeclampsia. Edge-weighted layout of the network was used to visualize super-clusters of the pathways and genes and ClusterOne Cytoscape plugin52 was used to identify pathways with the highest number of common genes. Those pathways are inside circles outlined by black lines and are named based on the most common types of pathways within the group. Size of the node is inversely proportional to the p-values. Panel (d). Gene Ontology analysis using Biobase International (http://www.biobaseinternational.com) datasets and network construction conducted similar to Panel (c) above. Panel (e). Transcription factor analysis of genes upregulated in preeclmapsia using Biobase software (TRANSFAC database) (http://www.biobaseinternational.com). Genes and their transcription factors were used to construct a network as in Panel (c). Panel (f). Correlogram of transcription factor matrices sharing common genes. Clusters were selected according to the dendrogram. Transcription factors representing groups of transcription factor matrices are shown below blue boxes.

