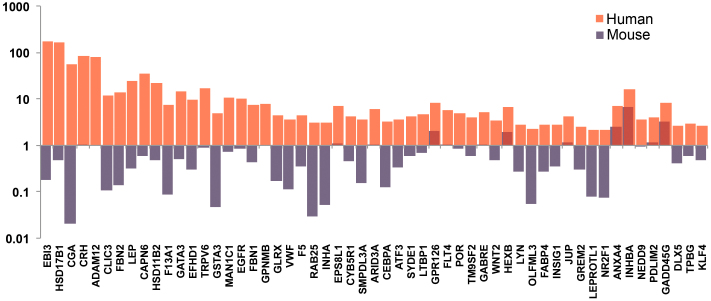
Figure 2. Expression of preeclampsia-specific genes in human and mouse placenta versus mean expression in other organs.
Degree of gene overexpression in placenta compared to other normal tissue in human (GSE9524) and mouse (GSE9724) datasets. Figure also depicts comparison of the ratio of expression of each selected gene in placenta versus all other normal tissue between human (GSE9524) and mouse (GSE9724) datasets. Genes used in this comparison were selected from among those identified through meta-analysis of preeclampsia case-control studies (Figure 1, Panel (a)). Y-axis represents the ratio of expression of each gene. Red bars indicate human and blue bars mouse genes.

