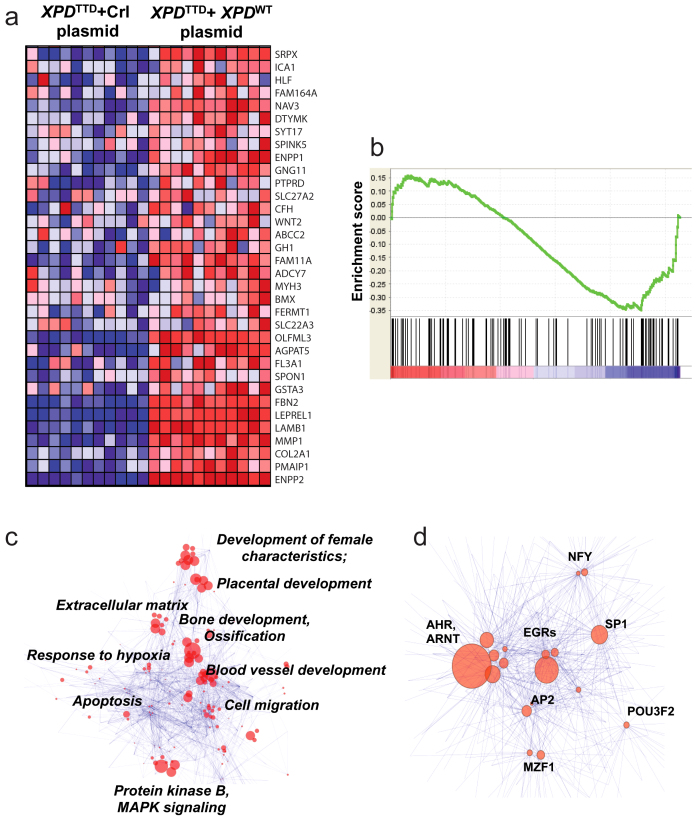
Figure 4. Transcriptome analysis of XPDTTD fibroblasts.
Panel (a). Heatmap constructed using 136 genes downregulated in preeclampsia meta-analysis demonstrating the 34 genes significantly-downregulated in XPDTTD Fibroblasts versus XPDTTD Fibroblasts transfected with wild-type XPD. Panel (b). GSEA of XPDTTD Fibroblasts with respect to genes downregulated in preeclampsia. The analysis demonstrates significant correlation (q < 0.1, Enrichment Score = 0.15) between many genes downregulated in preeclampsia and in XPDTTD Fibroblasts. Panel (c). GO analysis of gene signature of XPDTTD Fibroblasts using network visualization and analysis tool (as described in the Methods). Size of the nodes is inversely proportional to the p-values. Groups identified using clustering algorithm; most common GO terms are listed next to the node groups. Panel (d). Transcription factor analysis of the genes downregulated in XPDTTD fibroblasts using network visualization and analysis tool. Groups identified using clustering algorithm; most common transcription factors are listed next to the nodes. Size of the nodes is inversely proportional to the p-values.

