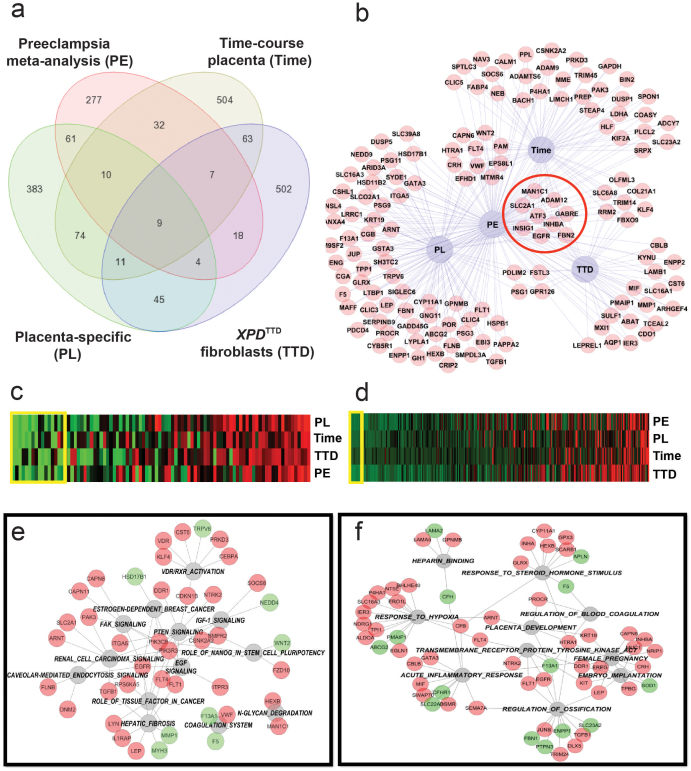
Figure 5. Integrative analysis of selected datasets related to the development of preeclampsia.
Panel (a). Selected datasets: 1) Gene expression arrays in placenta from four case-control studies of preeclampsia [GSE1058819, GSE1472220, GSE 2412922, and GSE470721], 2) placental gene signature obtained by comparing placenta versus other normal human tissues [GSE9524], 3) genes differentially expressed during mid- to term-gestation compared to first trimester [GDS252825], and 4) genes differentially-expressed in XPDTTD fibroblasts (cells predisposed to preeclampsia) versus XPDTTD fibroblasts transfected with wild-type XPD [obtained through personal communications28]. Individual analyses of each dataset and meta-analysis of preeclampsia case-control studies were done as discussed above. Venn diagrams created to display number of common genes between datasets. Panel (b). Differentially-regulated genes common between preeclampsia and at least one other dataset from panel A shown as a network. Common genes between all four datasets are outlined with a red circle. Panel (c–d). Canonical (Panel (c)) and GO (Panel (d)) pathway analysis using genelists created from analyses depicted in Panel (a). P-values from all analyses were combined using Fisher's test and displayed as a heatmap (green and red depict lowest and highest p-values, respectively). Yellow boxes on heatmaps depict pathways with combined p<0.01. These pathways were used for analyses depicted in Panels e–f. Panels (e–f). Gene-Pathway networks for Canonical (Panel (e)) and GO (Panel (f)) analyses constructed using pathways with combined p < 0.01 (in grey-outlined circles) obtained from analyses in panels (c–d). Red and green circles represent upregulated and downregulated genes, respectively.

