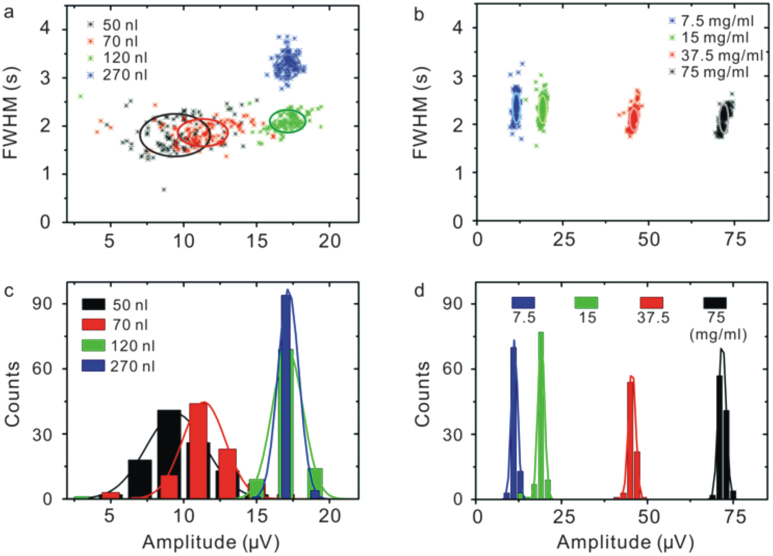
Figure 2.
Multiparametric density plots for the detection of magnetic droplets which are produced with (a) different volume of ferrofluid droplets (concentration: 15 mg/ml) and (b) different concentrations of ferrofluid in droplets (volume: 160 nl). The flow rate of mineral oil is Qoil = 500 nl/s. Circles are guide to the eyes. Histograms of the voltage amplitude change with (c) different volume of ferrofluid droplets and (d) different concentrations of ferrofluid in droplets. These plots collect measurement data of about 100 droplets.

