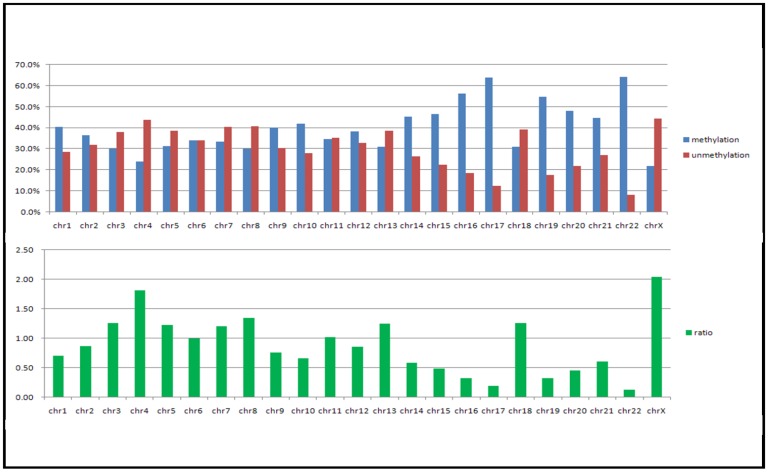
Figure 3.
Degree of hypomethylation across the various chromosomes of the MCF-7 genome. The relative number of probes in the array that are hypermethylated (blue) and hypomethylated (red) are plotted for each chromosome (Upper graph). The ratio of the hypomethylated probes to the hypermethylated probes are shown in the lower graph. The X chromosome and chromosome 4 are the most hypomethylated chromosomes, whereas chromosomes 7 and 22 are the most hypermethylated chromosomes.

