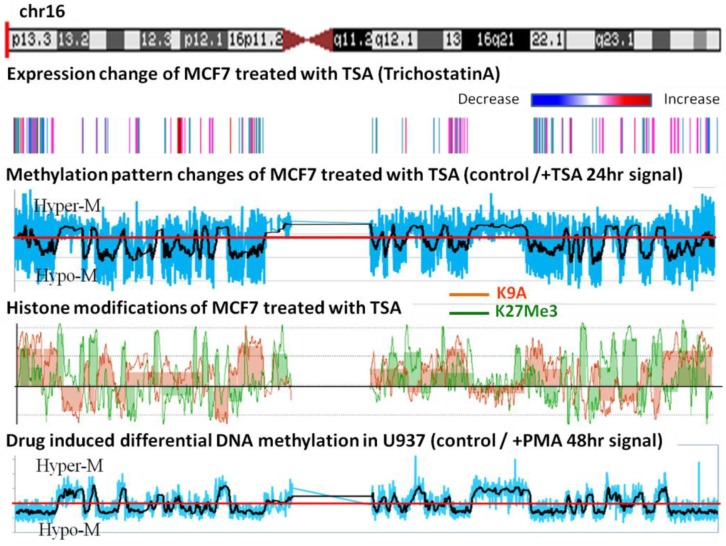
Figure 5.
Changes in methylation pattern after drug treatment. Top panel, chromosome 16. Second panel, transcriptome data from the Affymetric analysis of MCF-7 with the level of transcription from high (red) to low (blue). Third panel, differential methylation changes in the MCF-7 genome after treatment with TSA; the blue line represents the ratio of methylation before and after drug treatment and the black line represents the statistical average for the data. Fourth panel, histone modification changes after TSA treatment. En-bloc changes similar to the methylation changes are observed. Fifth panel, changes in methylation pattern of U937 cells before and after the induction of cell differentiation by PMA.

