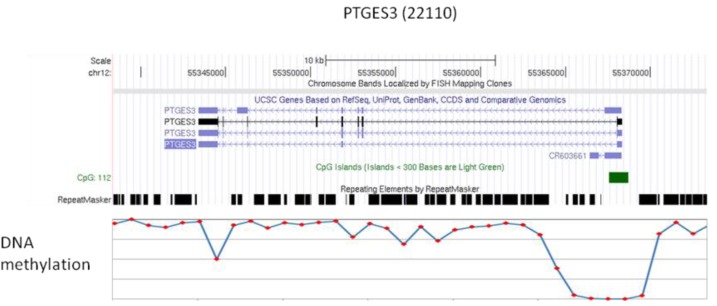
Figure 6.
An example of a highly expressed gene with promoter hypomethylation and gene body hypermethylation. Top panel is the gene map of PTGES3 with the expression number in parenthesis. The lower panel is the level of methylation as determined by bisulfite sequencing; the transcription is from right to left.

