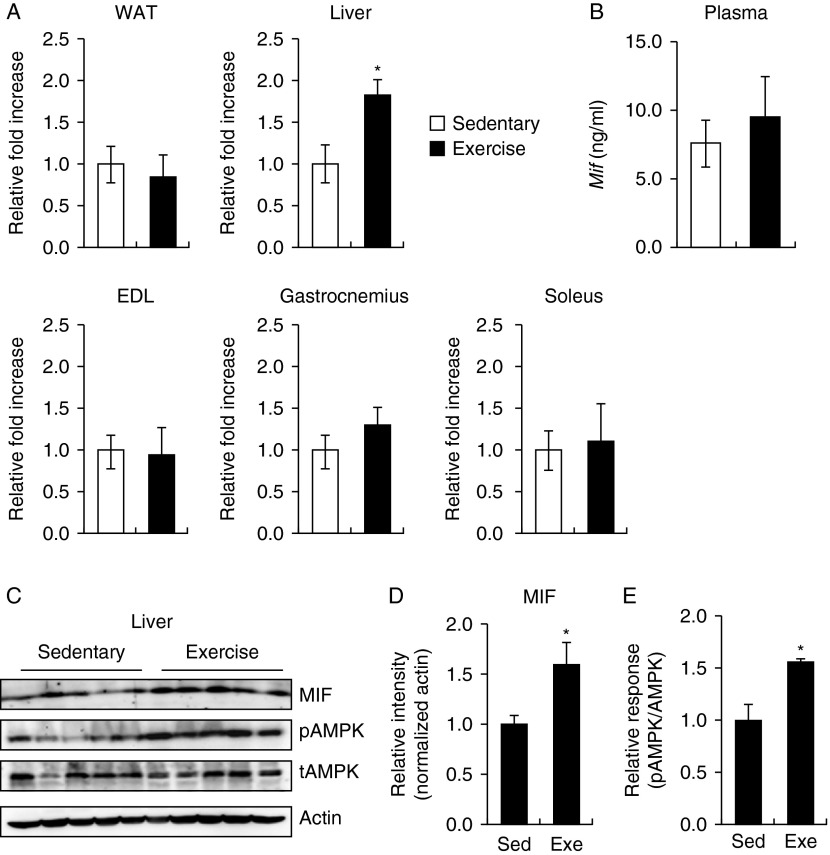
Figure 1.
Expression of MIF in sedentary (Sed) and exercised (Exe) mice. (A) RT-PCR analysis of MIF mRNA in various metabolic tissues. 18s rRNA levels were used as a control. (B) ELISA analysis of plasma MIF levels in mice. (C) Lysates from exercised or sedentary mouse tissues were subjected to western blotting using anti-phospho-AMPK, anti-total AMPK, and anti-MIF antibodies. Anti-β-actin antibodies were used to confirm equal protein loading. (D) Bar graph depicts the mean (±s.e.m.) ratio of intensity of MIF-to-actin bands and phospho-AMPK-to-total AMPK bands. (E) The levels of phosphorylated AMPK in liver were measured after exercise. Data are presented as the mean±s.e.m. (Figures are representative of ten sedentary and nine exercised mouse samples). *P<0.05 vs control values

