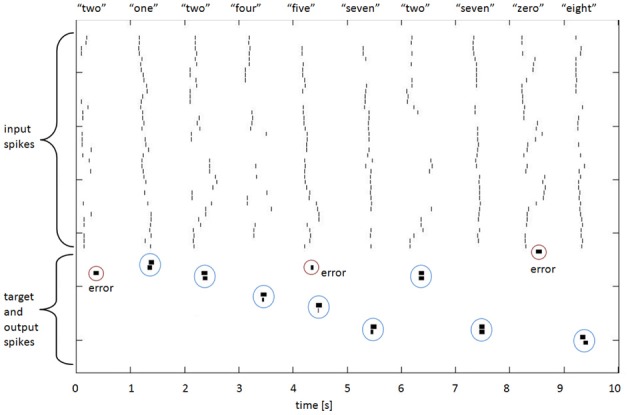
Figure 5.

Spike rasters for 10 spoken digits, showing input, target, and output spikes. The spike pairs circled with blue dotted lines indicate correct classifications (target and output spikes have been placed together in the raster plot to make visual assessment easier); the other output spikes, circled in red, are errors. The breadth of the target and output spikes—approximately 20 standard spike intervals—is explained in the text below.
