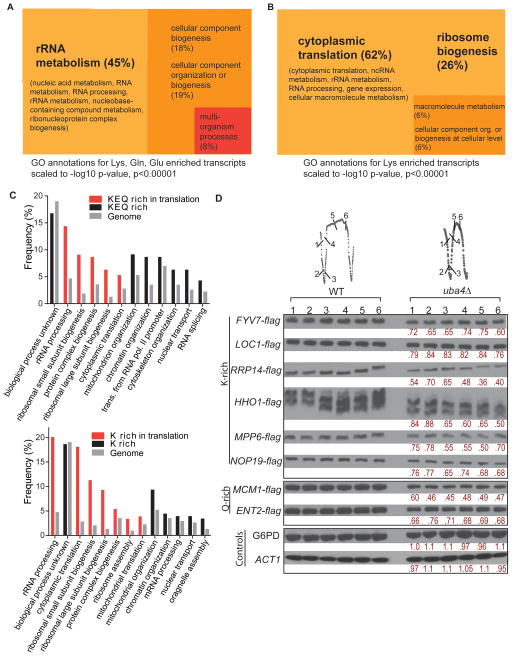
Figure 5. Lys, Gln, Glu codon-enriched genes are overrepresented in translation and growth-related functions.
(A) From a genome-wide analysis of codon usage frequency (Table S5), the genes with the highest frequencies of Lys, Gln and Glu (K, Q, E) (Z≥2) were selected and analyzed by Gene Ontology (GO) for highly significant GO terms (209 genes, p<0.00001), and visualized using scaled TreeMaps (See also Supplemental Information, Figure S5 and Table S6)
(B) Genes with the highest frequencies of Lys (K) codons (Z≥2) were selected and analyzed by Gene Ontology (GO) for highly significant GO terms (204 genes, p<0.00001), and visualized using scaled TreeMaps. (See also Table S6 and Figure S5 for genes overrepresented for Gln and Glu codons)
(C) Granular GO annotations for K, Q, E or K codon enriched genes to GO terms by biological processes, shown in comparison to genome-wide frequencies of the same biological process. Biological processes related to translation are shown in red
(D) Decreased levels of K and Q-rich proteins in tRNA thiolation-deficient cells. Several genes enriched for K or Q codons were arbitrarily selected, flag epitope tagged at their C-termini, and the encoded proteins were detected by Western blot in WT and uba4Δ mutant cells grown under continuous glucose-limitation. Quantifications of relative protein amounts comparing uba4Δ with WT are shown in red. Note: the 6 independent time points from each strain cycle can be compared since cells were maintained simultaneously at exactly the same cell density and fed the same medium. See also Figure S5.

