
Fig. 1. Foxp3+ Treg induction in CD4+ T cells co-cultured with HCV-infected hepatocytes that express Gal-9 and TGF-β.
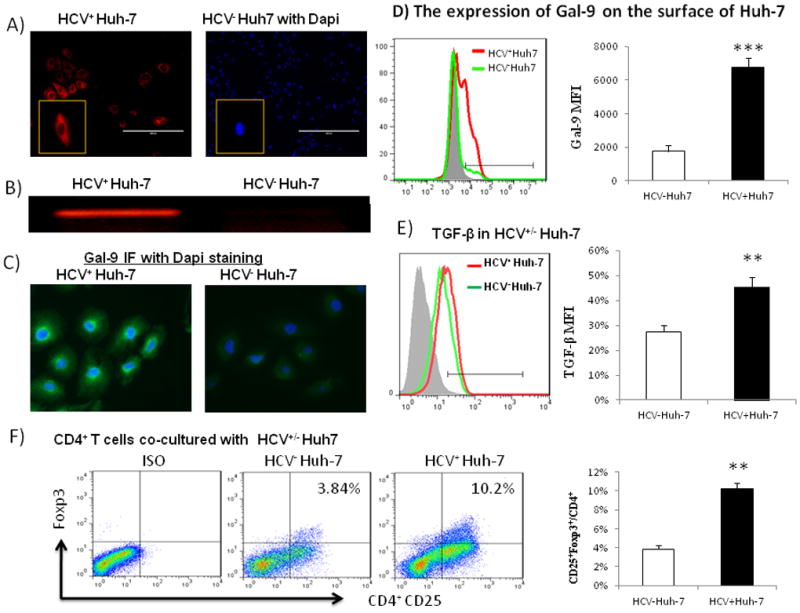
A) HCV core protein is detected positive by immunofluorescence staining in HCV JFH-1-transfected Huh-7 cells, but not in the mock-transfected Huh-7 cells that are double stained with Dapi. x 40 magnificence imaging is inserted in the left lower corner. B) HCV core mRNA is detected by RT-PCR in the supernatant of HCV JFH-1-transfected Huh-7 cells, but not in the mock-transfected Huh-7 cells. C) Gal-9 expression is up-regulated in HCV+ Huh-7 cells compared with HCV− Huh-7 cells, double stained with Dapi. D) The percentage of Gal-9 positive cell frequency is up-regulated on the surface of HCV+ Huh-7 cells (red line) compared with HCV− Huh-7 cells (green line). Isotype control staining is shown as a grey-filled area. The summarized MFI of Gal-9 expression level on HCV+/− hepatocytes from three independent experiments is shown on the right. ***P<0.001. E) TGF-β expression is up-regulated in HCV+ Huh-7 cells (red line) versus HCV− Huh-7 cells (green line). Isotype control staining is shown as grey-filled area. Summary data of TGF-β expression level in HCV+/− hepatocytes from three independent experiments is shown in the right, **P<0.01. F) CD25+Foxp3+ Treg induction following co-culture of purified CD4+ T cells with HCV+ Huh-7 or HCV− Huh-7 hepatocytes, as described in Materials and Methods. Isotype-matched antibodies and fluorescence minus one (FMO) controls were used to determine background levels of staining and adjust multicolor compensation as a gating strategy. Summary data using CD4+ T cells isolated from 8 healthy subjects is shown in the right panel. **P<0.01.