
Figure 2. Determination of OPN-FL, OPN-R and OPN-L levels in synovial fluid of patients with osteoarthritis, psoriatic arthritis and rheumatoid arthritis by ELISA.
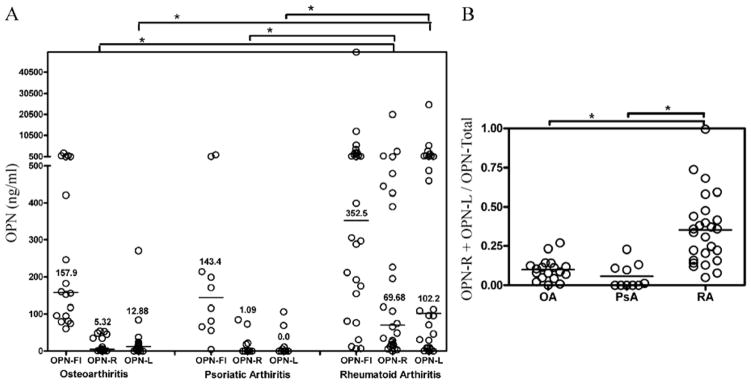
A, Osteoarthritis (OA) n = 18, psoriatic arthritis (PsA) n = 10, rheumatoid arthritis (RA) n = 26. Bars are median values of each disease group. *P < 0.003 by Wilcoxon rank test. B, The ratio of cleaved OPN levels (OPN-R plus OPN-L) to total OPN (sum of the three different OPN forms) for RA, OA and PsA. *P < 0.003.