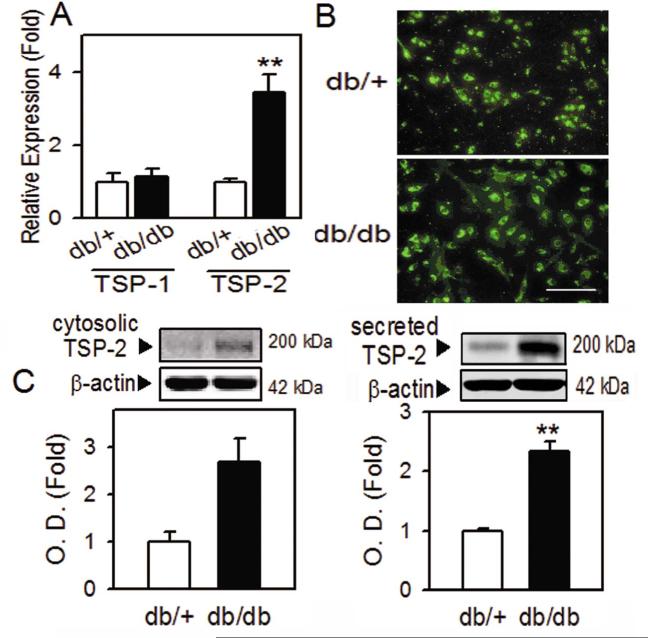
Figure 3.
Upregulation of TSP-2 in diabetic BMACs.
A. TSP-1 or TSP-2 mRNA in normal and diabetic BMAC was measured by qRT-PCR. B. Expression of TSP-2 was determined in fluorescence microscope. C. Cytosolic (left panel) or secreted (right panel) TSP-2 protein level was detected in western blot. A:n=3-6, B:n=3, C: n=4-6, Scale bar: 200 μm, *p<0.05, **p<0.01 vs. db/+. Data were expressed as mean ± SEM and analyzed using Student’s t-test or one-way ANOVA followed by Duncan’s test to determine the significant differences between treatment groups.

