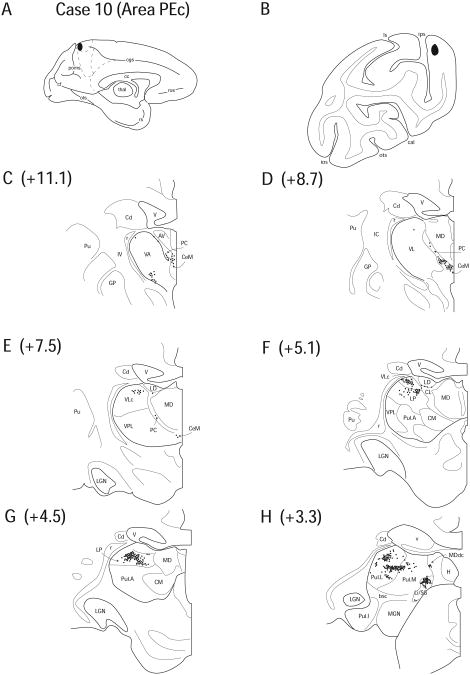
Figure 13.
Diagram illustrating Case 10 placement of retrograde tracer (black oval) in area PEc on (A) medial surface and (B) coronal section. (C – H) represent Neurolucida chartings of coronal sections through the thalamus from anterior to posterior demonstrating the distribution of labeled neurons. Note the lack of labeling in the anterior nuclei and the heavy labeling observed in the posterior nuclei.

