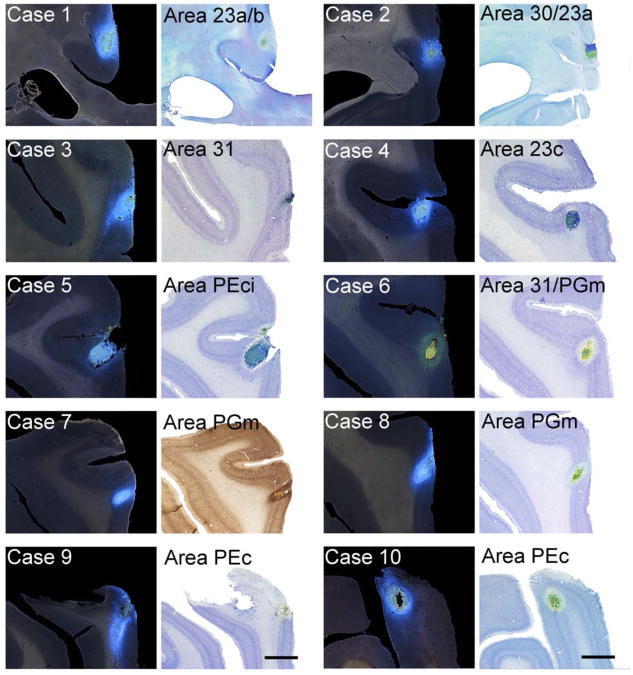
Figure 2.
Epi-fluorescent photomicrographs of coronal sections through the injection sites of all 10 cases with adjacent Nissl or Neu-N stains. (A) Case 1 – FB injection involving areas 23a/b, (A′) Nissl stained section of the injection site in Case 1; (B) Case 2 – FB injection involving area 30/23a, (B′) Nissl stained section of the injection site in Case 2; (C) FB injection of Area 31, (C′) Nissl stained section of the injection site in Case 3; (D) Case 4 – FB injection involving area 23c, (D′) Nissl stained section of the injection site in Case 4; (E) Case 5 – FB injection involving area PEci, (E′) Nissl stained section of the injection site in Case 5; (F) Case 6 – DY injection involving area 31, (F′) Nissl stained section of the injection site in Case 6; (G and H) Cases 7 and 8 – FB injections involving area PGm, (G′ and H′), Neu-N and Nissl stained sections of the injection sites in Cases 7 and 8, respectively; (I and J) Cases 9 and 10 – FB injections involving area PEc (I′ and J′), Nissl stained section of the injection sites in Cases 9 and 10. White arrows identify the injection site in epi-fluorescent photographs (A – J), while black arrows represent cytoarchitectonic boundaries in Nissl and Neu-N stained sections (A′ – J′). Scale bar = 2.0 mm.

