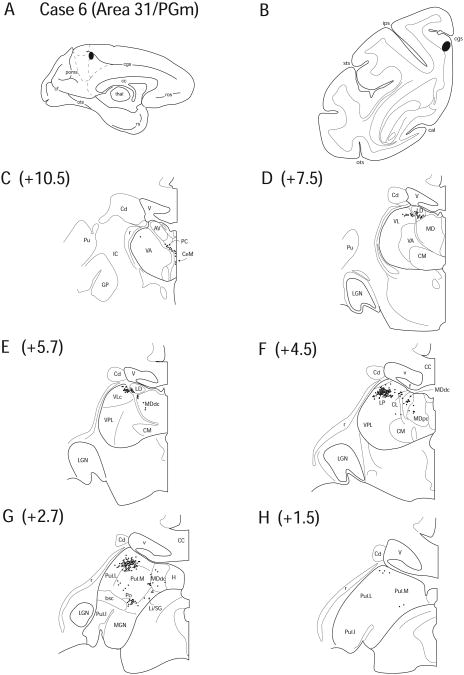
Figure 9.
Diagram illustrating Case 6 placement of retrograde tracer (black oval) in area 31/PGm on (A) medial surface and (B) coronal section. (C – H) represent Neurolucida chartings of coronal sections through the thalamus from anterior to posterior demonstrating the distribution of labeled neurons. Note the lack of labeling in the anterior nuclei except LD.

