
Fig. 2.
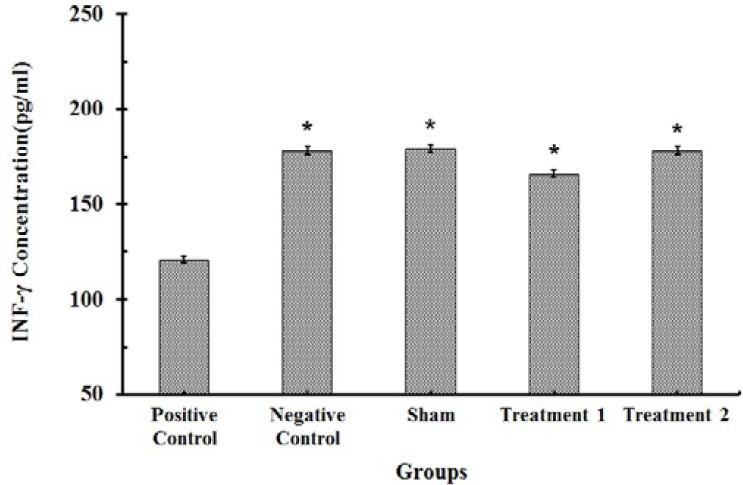
IFN-γ contents in serum of rats (n=8). Each value represents Mean ± SEM. Significant difference versus positive control group is shown by * (P<0.001).
Official websites use .gov
A
.gov website belongs to an official
government organization in the United States.
Secure .gov websites use HTTPS
A lock (
) or https:// means you've safely
connected to the .gov website. Share sensitive
information only on official, secure websites.
IFN-γ contents in serum of rats (n=8). Each value represents Mean ± SEM. Significant difference versus positive control group is shown by * (P<0.001).