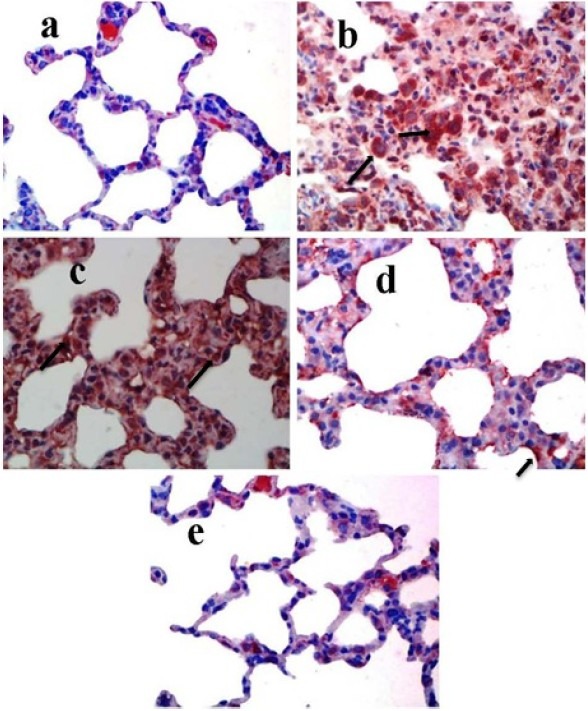
Fig. 5.

Immunohistochemical staining of rat lung tissue sections using α-SMA antibody. Original magnification of all images is ×40. (a) Negative control group. (b) positive control group. (c) BLM + CAPE (5 μmol/kg) group. (d) BLM + CAPE (10 μmol/kg) group.(e) Sham group.
