
Figure 4.
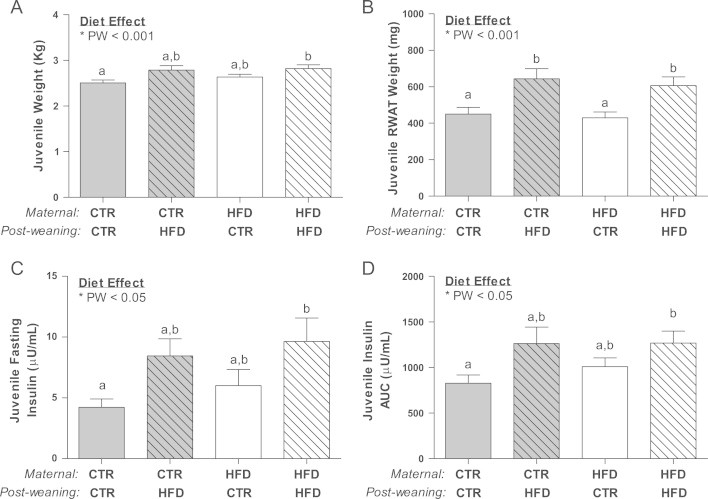
HFD/HFD juvenile animals were significantly heavier than the CTR/CTR, while CTR/HFD displayed a similar trend (A) and RWAT was significantly elevated in the CTR/HFD and HFD/HFD juveniles (B), which was due to a significant effect of the post-weaned diet (PW; p<0.01). HFD/HFD fasting (C) insulin and insulin area under the curve (D) were significantly elevated when compared to CTR/CTR and significantly affected by the post-weaned diet (PW; p<0.05). Weight, RWAT weight, fasting insulin and insulin AUC were significantly affected by the post-weaning diet. Two-way ANOVA with Bonferroni's post-hoc analysis; bars labeled with different letters “a” or “b” indicate a significant difference (p<0.05) from each other, while bars with the same letter are not significantly different from each other. CTR/CTR, n=22; CTR/HFD, n=9; HFD/CTR, n=14; HFD/HFD, n=21.