
Fig. 3.
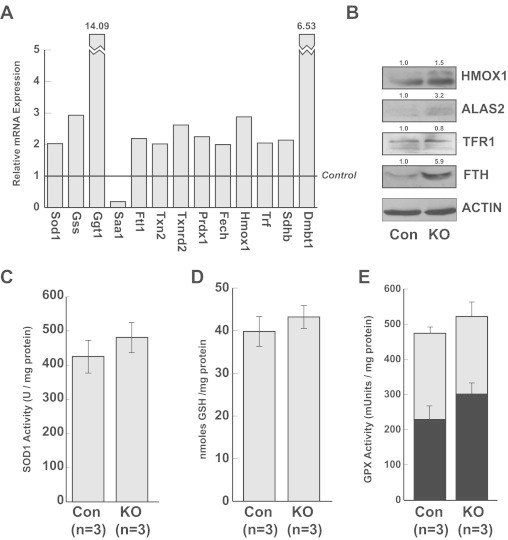
Compensatory mechanisms inSod2−/−hepatocytes. (A) Results from gene array detailing 13 genes with greater than twofold expression difference in Sod2−/− compared with control. Differences are derived from pooled populations of 9 mice per group. (B) Representative iron homeostasis genes are altered in Sod2−/− hepatocytes. HMOX1—heme oxygenase 1, ALAS2—aminolevulinic acid synthase 2, TFR1—transferrin receptor 1, FTH—ferritin heavy chain. Numbers above blots indicate quantitation using ImageJ software. (C) SOD1 activity assay demonstrating elevated SOD1 activity in Sod2−/− liver homogenates compared to control. (D) Total GSH is slightly elevated in Sod2−/− liver homogenates compared to control. (E) Sod2−/− liver homogenates have increased selenium-dependent (black bar), selenium independent (gray partition), and total GPx (overall height) compared to control. Results in (C), (D), and (E) are not statistically significant.