
Fig. 7.
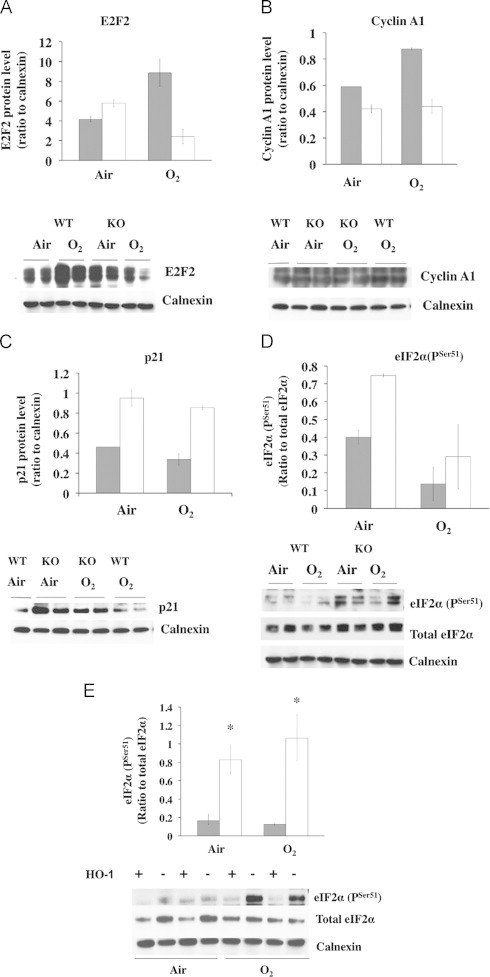
Lung protein content in O2/air recovered mice. In (A) lung E2F2, (B) cyclin A1, (C) p21, and in (D) phosphorylated eIF2α. Upper panels: densitometry values of WT (grey bars) and KO (open bars) normalized to Calnexin loading controls. Values are the mean±S.E. of 2. Lower panels: representative Western blots of each signal with calnexin as loading control. For eIF2α, the ratio of serine 51 phosphorylated signal over total protein content is shown. In E: level of serine 51 phosphorylated eIF2α over total in KO and WT MEF. Grey bars: WT, open bars: KO. Values are the mean±S.E. of 3 in each group. *: p<0.05 vs WT. Lower panel: representative Western blot of serine 51 positive signal over total. Calnexin is the loading control.