
Fig. 2.
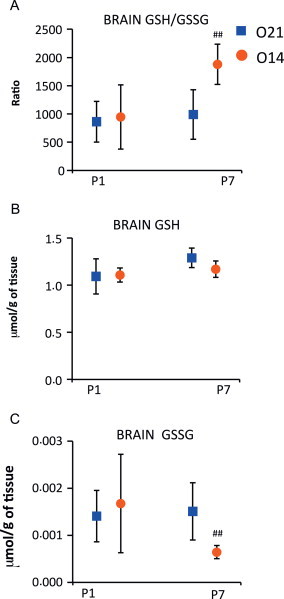
Reduced and oxidized glutathione levels at P1 and P7 in the brains of mice pups born under hypoxic conditions (O14; FiO2=14%; n=7) or under normoxic conditions (O21; FiO2=21%; n=7). Panel A shows the reduced (GSH) to oxidized (GSSG) glutathione ratio (GSH/GSSG). Panel B shows reduced glutathione (GSH) levels. Panel C shows oxidized glutathione (GSSG) levels. Analytical determinations were performed using ultra-high performance liquid chromatography coupled to mass spectrometry (LC–MS/MS). Comparisons between groups were made using the Wilcoxon rank sum test. Statistical differences are expressed are: ⁎p<0.05 vs. O21 group at P1; and ## p<0.01 vs. O21 group at P7.