
Fig. 5.
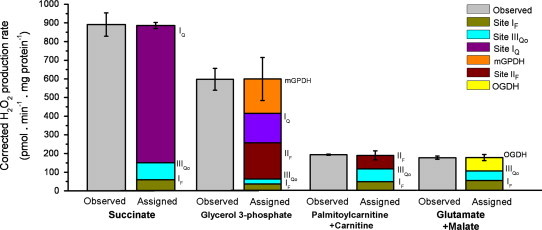
Native rates of superoxide/H2O2 production by mitochondria oxidizing different substrates. Observed total rate of H2O2 production (gray bars) and sum of assigned rates of superoxide/H2O2 production from different sites (colored stacked bars) in the presence of different substrates as indicated: 5 mM succinate; 27 mM disodium rac-α/β-glycerol phosphate (25% active optical isomer sn-glycerol 3-phosphate); 15 µM palmitoyl-L-carnitine plus 2 mM L-carnitine; and 5 mM L-glutamate plus 5 mM L-malate. With each substrate, the reduction states of NAD(P)H and cytochrome b566 were measured in parallel with H2O2 production and the calibration curves in Fig. 2 were used to predict the rates of production from sites IF and IIIQo. With succinate, 4 µM rotenone was subsequently added to allow calculation of the rate from site IQ as described in the text (data from Fig. 4d). With glycerol 3-phosphate, 1 mM malonate and 4 µM rotenone were subsequently added to allow calculation of the rates from sites IIF and IQ, respectively. The rate assigned to mGPDH was calculated by difference. With palmitoylcarnitine plus carnitine, 1 mM malonate was subsequently added to allow calculation of the rate from site IIF (data recalculated from [18]). With glutamate plus malate, the rate assigned to OGDH was calculated by difference (data recalculated from [21]). Results are means±SEM (n=4–6); the error bars on the sum columns show the combined propagated errors in the total sum value. There was no significant difference between observed and assigned rates with succinate or with palmitoylcarnitine plus carnitine (Welch's t-test; p<0.05).