
Fig. 2.
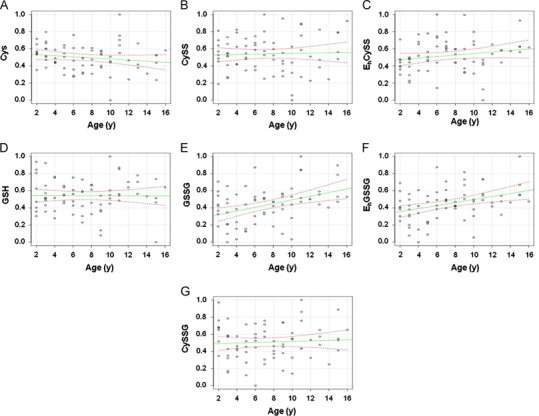
Plasma thiol metabolites and redox potentials plotted as a function of age (years). The data were transformed and normalized as described in the Method section. Values for each metabolite were also scaled using min/max scaling with the minimum value equal to zero and the maximum equal to one. The green line represents the linear trend and the dotted red lines indicate the 95% confidence interval.