
Fig. 3.
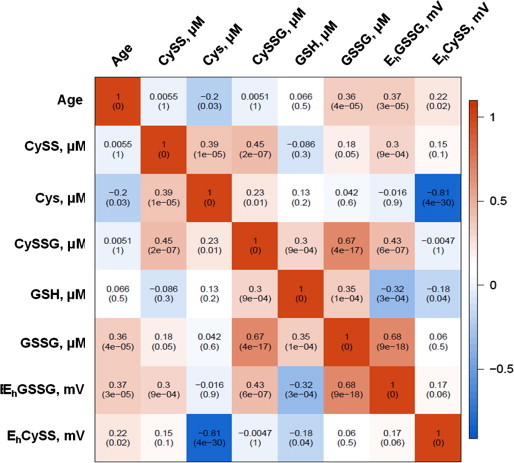
A heat map representation of the Spearman correlation matrix of the marmoset plasma metabolites. Spearman correlation was calculated for each metabolite, redox potential and age is located in each cell of the matrix. The p-value of the correlation is in parentheses.