
Fig. 4.
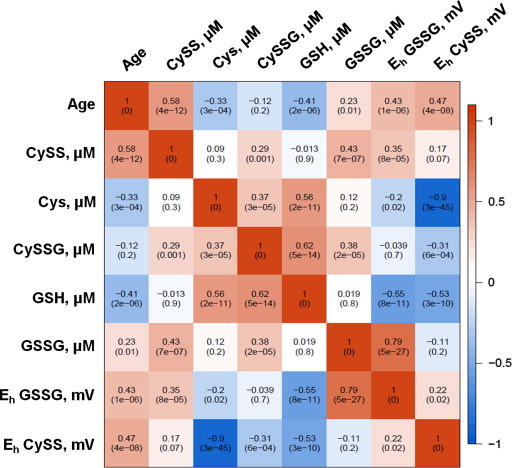
A heat map representation of the Spearman correlation matrix of the human plasma metabolites [11]. Spearman correlation was calculated for each metabolite, redox potential and age is located in each cell of the matrix. The p-value of the correlation is in parentheses.