


Fig. 2.
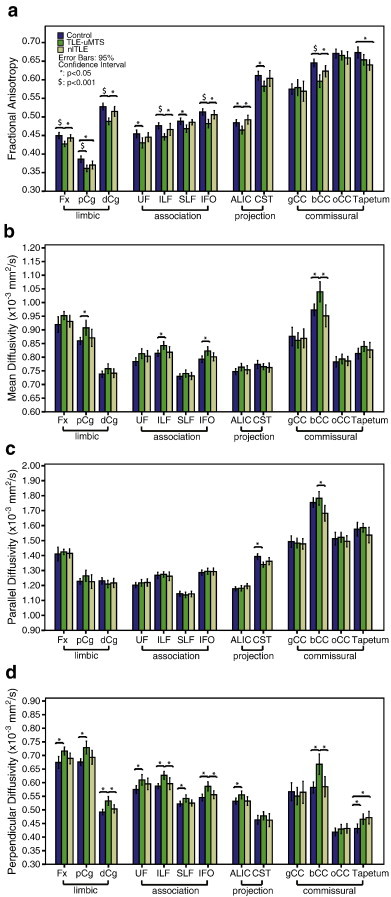
The mean and 95% confidence interval of a) FA, b) MD, c) parallel and d) perpendicular diffusivities of the thirteen white matter tracts (averaged across left and right) in TLE + uMTS (n = 23), nl-TLE (n = 15) and controls (n = 21). The tracts are categorized into limbic, association, projection and commissural fibers. Significant between-group differences after FDR correction are marked. Many tracts show reduction of FA or elevations of perpendicular diffusivity, although this is more prevalent for the TLE + uMTS patients with the reduction in FA being primarily explained by increased perpendicular diffusivity.