
Fig. 2.
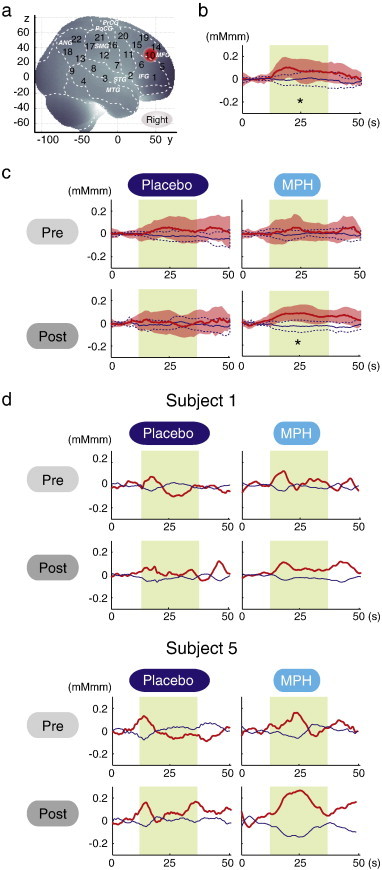
The channel location and waveforms of oxy-Hb (red line) and deoxy-Hb (blue line) signals for right CH 10. The green area indicates the go/no-go task period. Significant (one-sample t-test, p < .05) conditions are indicated by asterisks. a. On-brain channel locations (right hemisphere) are statistically estimated for the group of subjects (including both ADHD and control) and exhibited in MNI space. CH 10 is indicated in red. b. Grand averages for control subjects. Standard deviations among the 16 subjects are exhibited as pale red (oxy-Hb) and blue dotted (deoxy-Hb) areas. Each time line is adjusted to the average value for a baseline period of zero. Oxy-Hb and deoxy-Hb signals are shown in units of mM·mm. c. Grand averages for ADHD subjects for pre-/post- and placebo/MPH conditions are illustrated. d. Graphs for ADHD individuals for pre-/post- and placebo/MPH conditions. Subject 1 is a 7-year-old boy and subject 5 is a 6-year-old girl (corresponding to Table 1).