
Fig. 5.
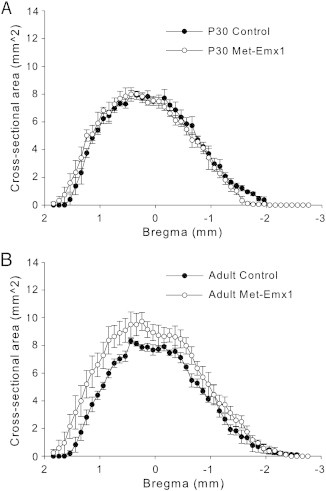
The striatum of adult Met–Emx1 mice is larger than the striatum of control mice. Average cross-sectional area of the striatum is plotted versus estimated bregma level for P30 (A) and adult (B) animals. Overall the distribution of area is significantly different in adult control and Met–Emx1 mice (D = 0.2157, p = 0.002, K–S test) but not between P30 control and Met–Emx1 mice (D = 0.0572, p = 0.984, K–S test). Data represent n = 4 brains per genotype and age, points represent the mean areas with the error bars signifying the SEM.