
Figure 2.
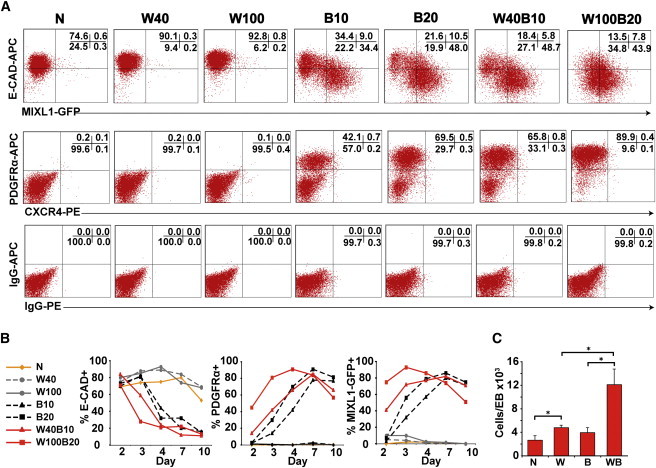
WNT3A Accelerates BMP4-Dependent Mesoderm Differentiation and Enhances EB Size
(A) Representative flow cytometry profiles showing the percentage of MIXL1-GFP+, E-CAD+, CXCR4+, and PDGFRα+ cells in d4 EBs differentiated in APEL medium supplemented with the indicated growth factors. These profiles form part of the time-course experiment shown in (B). The fraction of cells present in each quadrant is indicated.
(B) Graphical representation of flow cytometry data showing the percentage of MIXL1-GFP+, E-CAD+, and PDGFRα+ cells in EBs differentiated in APEL medium supplemented with the growth factors indicated at different time points. The concentration of growth factors in ng/ml is indicated. Data are shown from one representative experiment, with an independent example shown in Figure S3A.
(C) Histogram representing the mean cell number per EB at d4 in cultures induced with the growth factor combinations indicated. Data represent the mean ± SEM from five independent experiments. Groups were compared using Student’s t test. *p < 0.05.
N, no growth factors; W, WNT3A; B, BMP4; WB, WNT3A/BMP4. See also Figure S3.