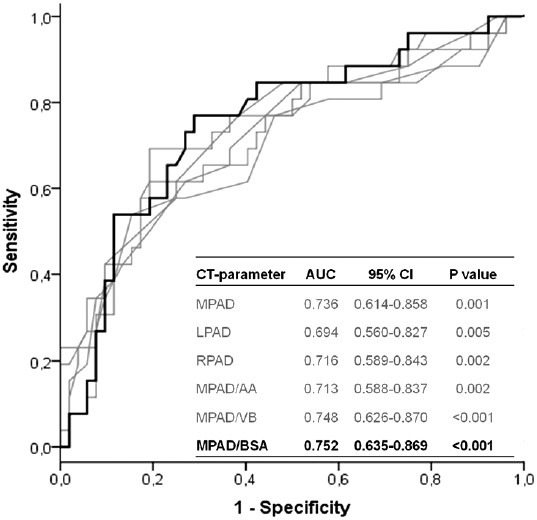
Figure 3.

ROC analyses of CT parameters for the prediction of borderline PH. AA: ascending aorta; AUC: area under the curve; BSA: body surface area; CI: confidence interval; CT: computed tomography; LPAD: left pulmonary artery diameter; MPAD: main pulmonary artery diameter; RPAD: right pulmonary artery diameter; VB: vertebral body.
