. 2013 Apr-Jun;4(2):192–197. doi: 10.4103/0976-237X.114878
Copyright: © Contemporary Clinical Dentistry
This is an open-access article distributed under the terms of the Creative Commons Attribution-Noncommercial-Share Alike 3.0 Unported, which permits unrestricted use, distribution, and reproduction in any medium, provided the original work is properly cited.
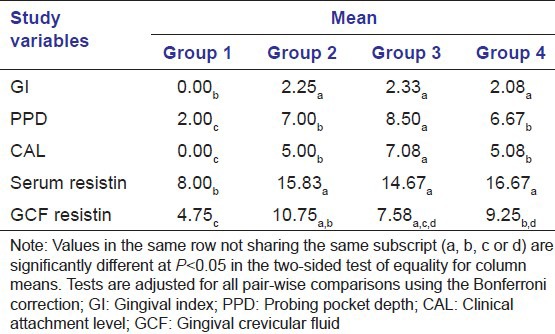
Table 2.
Comparison of variables between the various study groups