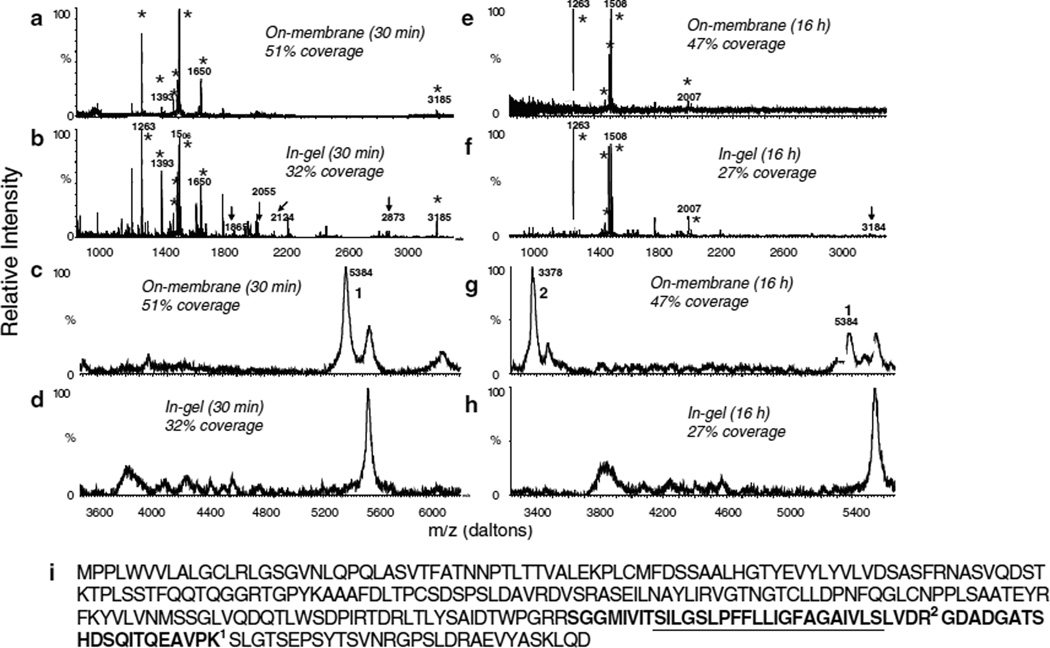
Fig. 2.
Comparison of MALDI MS spectra obtained from 3 pmol of uroplakin III (UPIII) after (a, c) 30 min on-membrane digestion, (b, d) 30 min in-gel digestion, (e, g) 16 h on-membrane digestion, (f, h) 16 h in-gel digestion, (i) amino acid sequence of bovine UPIII. The underlined amino acids correspond to the transmembrane domain of the protein. In the spectra, the stars indicate UPII peptides detected after both in-gel and on-membrane digestion, the arrows indicate missed cleavage peptides that appear only after in-gel digestion, and the numbers indicate peptides from the UPII sequence shown in (i) detected only after on-membrane digestion. Spectra shown in (a), (b), (e), and (f) were collected in reflectron mode and spectra shown in (c), (d), (g), and (h) in linear mode (reproduced from (2) with permission from the American Chemical Society).

