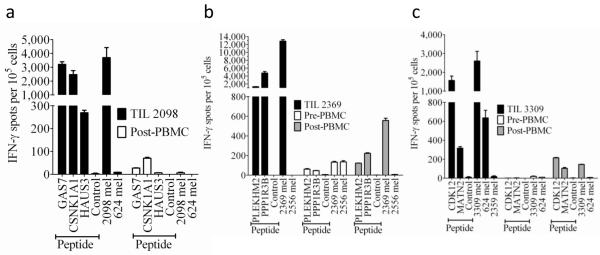
Figure 4. IFN-γ ELISPOT responses of TIL and PBMC obtained prior to and following autologous TIL transfer.
Samples of PBMC prior to adoptive TIL transfer as well as samples of PBMC obtained approximately one month following transfer were evaluated along with samples of infused TIL. A pre-treatment sample was not available for subject 1, and the pre-treatment sample analyzed from subject 2 was obtained approximately one month following an adoptive TIL transfer that was administered in the absence of non-myeloablative chemotherapy one month prior to infusion of the TIL analyzed in (b). TIL 2098 from subject 1 was cultured with HLA-A*0201+ COS-7 cells (a), TIL 2369 from subject 2 was cultured with HLA*0101+ COS7 cells (b), and TIL 3309 from subject 3 were cultured with HLA*1101+ COS-7 cells (c) that were pulsed with candidate nonamer peptides for two hours at 370C. T cells were also cultured with autologous as well as allogeneic tumor cells, and in addition, each of the individual T cell populations were stimulated in parallel cultures with PMA plus ionomycin (PMA/I). The numbers of IFN-γ ELISPOTS per 105 T cells generated in responses to PMA/I were as follows: Subject 1 TIL 2098:7,300, subject 1 post transfer PBMC:4,700, Subject 2 TIL 2369:21,800, Subject 2 pre-transfer PBMC:21,800, Subject 2 post-transfer PBMC:11,000, Subject 3 TIL 3309:7,700, Subject 3 pre-transfer PBMC: 12,500, Subject 3 post-transfer PBMC:26,300. TIL 2098 was plated at 2,000 cells per well, TIL 2369 and 3309 were plated at 1,000 cells per well, and PBMC were plated at 100,000 cells per well, whereas all of the groups stimulated with PMA/I were plated at 1,000 cells per well. The error bars represent the mean + and − the standard error of the mean of three replicate wells per group.

