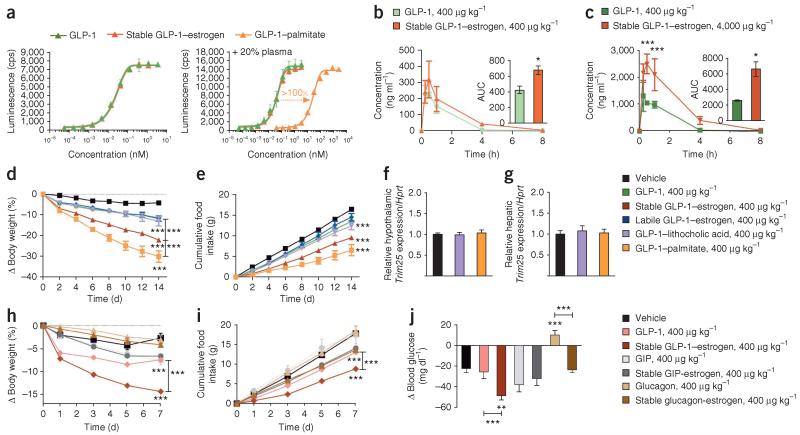
Figure 5.
In vitro and in vivo pharmacokinetic profile of the stable GLP-1–estrogen conjugate and comparative efficacy to alternative combinations of peptides and nuclear hormones. (a) Dose-response curves for in vitro GLP-1R activation in the absence of human plasma (left) and the presence of 20% human plasma (right) of a GLP-1 analog (green) and the stable GLP-1–estrogen conjugate (red) compared to the acylated GLP-1 control (orange). A minimum of three separate experiments were conducted for each compound with or without human plasma. Data in a are means ± s.d. (b,c) In vivo plasma concentrations and the AUC (insets), as measured by a mass spectrometry-based analysis, of the GLP-1 analog and stable conjugate at a dose of 400 μg per kg body weight (b) and the maximal dose of 4,000 μg per kg body weight (c) after a single subcutaneous injection in lean mice (n = 9 male mice per group). (d,e) Effects on body weight (d) and cumulative food intake (f) (n = 8 male mice per group) in a separate experiment after daily subcutaneous injections of a GLP-1 analog (green), the stable GLP-1–estrogen conjugate (red), the labile GLP-1–estrogen conjugate (blue), the GLP-1–lithocholic acid conjugate (violet) or GLP-1–palmitate (yellow-orange) at a single dose of 400 μg per kg body weight for 14 d. (f,g) Effects on the fold induction of Trim25 mRNA relative to a housekeeping gene (Hprt) from extracted hypothalamus (f) and liver (g) of treated mice. (h–j) Effects on body weight (h), cumulative food intake (i) and ad lib blood glucose concentration (j) (n = 8 mice per group) in a separate experiment after daily subcutaneous injections of a GLP-1 analog (salmon), the stable GLP-1–estrogen conjugate (red), a GIP analog (light gray), the GIP-stable estrogen conjugate (dark gray), a glucagon analog (light brown) or the glucagon-stable estrogen conjugate (dark brown) at a dose of 400 μg per kg body weight. Data in b–j represent the means ± s.e.m. *P < 0.05, **P < 0.01, ***P < 0.001 by ANOVA comparing compound injections to vehicle unless otherwise noted.

