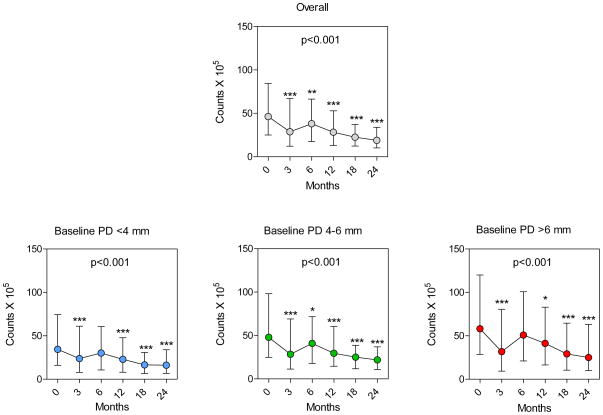
Fig. 2.
Plots of median total DNA probe counts (× 105, interquartile ranges) (top panel) at baseline (pre-therapy), and at 3, 6, 12, 18 and 24 months post-therapy for all sites and sites subset according to baseline pocket depth categories of <4, 4–6, >6 mm (lower panels). Total counts were averaged within a subject and then the medians across subjects for each visit and pocket depth category were computed separately. Significance of differences over time was determined using the Friedman test (p values presented in each graph). Dunn’s multiple comparison post-hoc test was used to determine significance of differences between baseline median counts and median counts at 3, 6, 12, 18 and 24 months post-therapy* p< 0.05, ** p< 0.01, *** p< 0.001.

