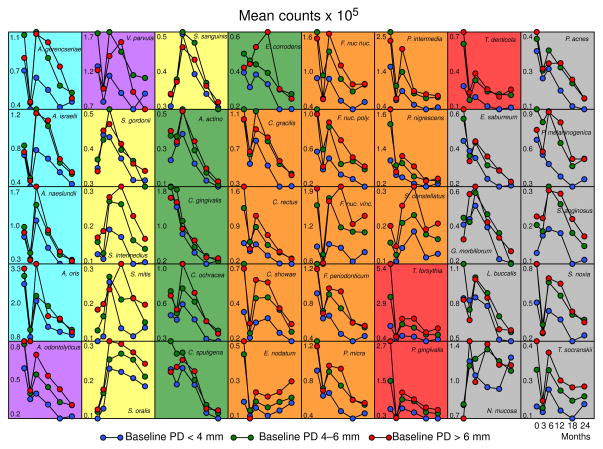
Fig. 7.
Plots of median counts (×105) for subgingival species at baseline (pre-therapy), and at 3, 6, 12, 18 and 24 months post-therapy at sample sites with baseline pocket depths of <4, 4–6 and >6 mm. Counts of each species were averaged within a subject for each pocket depth category separately and then the medians across subjects for each visit were computed separately. Significance of differences over time was determined using the Friedman test and adjusted for 40 comparisons (Socransky et al. 1991). The y-axes values represent median counts × 105. Species counts that did not differ significantly over time were F. nucleatum ss vincentii (PD <4 mm), L. buccalis (PD >6 mm), N. mucosa (PD <4, 4–6 mm), S. anginosus (PD >6 mm), S. constellatus (PD <4, 4–6, >6 mm), S. gordonii (PD >6 mm), S. intermedius (PD <4, 4–6, >6 mm), S. mitis (PD <4, 4–6, >6 mm), S sanguinis (PD >6 mm), T. socranskii (PD >6 mm), V. parvula (PD 4–6, >6 mm). The background shading represents the complexes described by Socransky et al. (1998).

