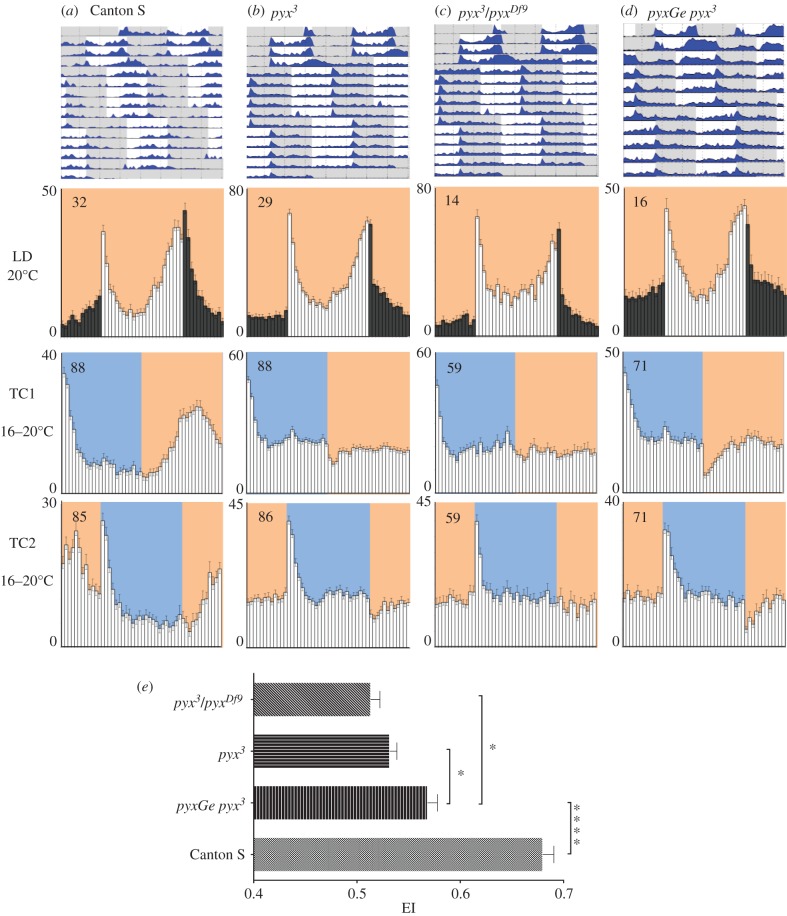
Figure 1.
Pyrexia is required for synchronization to 16 : 20°C TCs in constant light. Locomotor behaviour of (a) Canton S, (b) pyx3, (c) pyx3/pyxDf9 and (d) pyxGe pyx3 male flies was analysed in LD, followed by two 16 : 20°C TCs in constant light (LL) each of which was delayed by 6 h compared with the previous regime. Top graphs show double-plotted average actograms, depicting behavioural activity throughout the experiment. Below, for the LD and TC parts, the last 3 days were averaged and plotted as histograms. On the y-axis, average activity (beam crossings/30 min) is indicated, while x-axis represents the 24 h day, whereby each column represents 30 min. White and grey bars (histograms) or areas (actograms) indicate light and dark periods, respectively. Blue areas indicate cold, orange areas warm periods. Absolute temperatures are indicated to the left. The number of animals analysed is indicated in each histogram (average of several independent experiments). Average actograms are from one experiment in which 8–16 flies were tested for each genotype. (e) Plotting of the EI for TC1 and TC2 with error bars indicating s.e.m. Statistical significance was assessed by one-way ANOVA followed by Fisher's LSD post hoc test (*p-values < 0.05; ****p-values < 0.0001).

