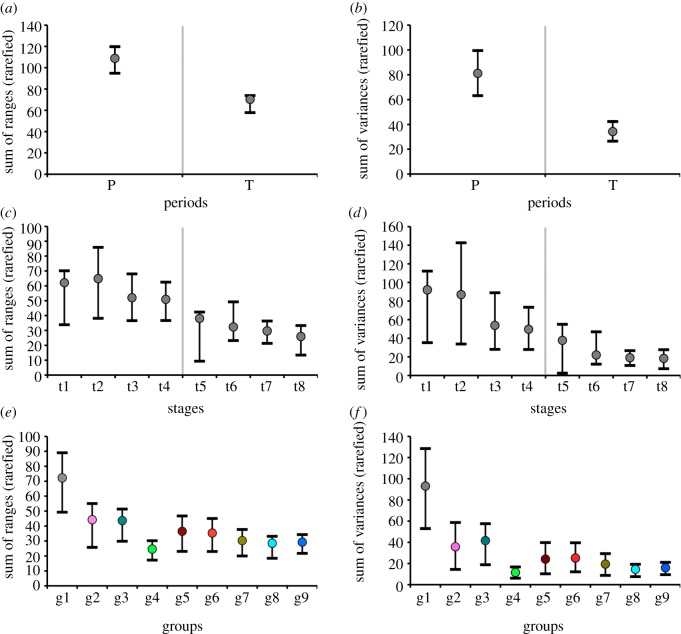
Figure 2.
Rarefied median disparity values and associated confidence intervals, based on the sum of ranges (a,c,e) and the sum of variances (b,d,f). (a,b) Disparity in Permian (P) and Triassic (T) taxa; (c,d) disparity of taxa assigned to time intervals t1–t8; interval abbreviations: t1, Roadian–Wordian; t2, Capitanian; t3, Wuchiapingian; t4, Changhsingian; t5, Induan–Olenekian; t6, Anisian; t7, Ladinian; t8, Carnian–Norian and (e,f) disparity of taxa assigned to groups g1–g9 (see figure 1 for group notations and colour codes). Vertical grey bars mark the Permian–Triassic boundary. (Online version in colour.)

