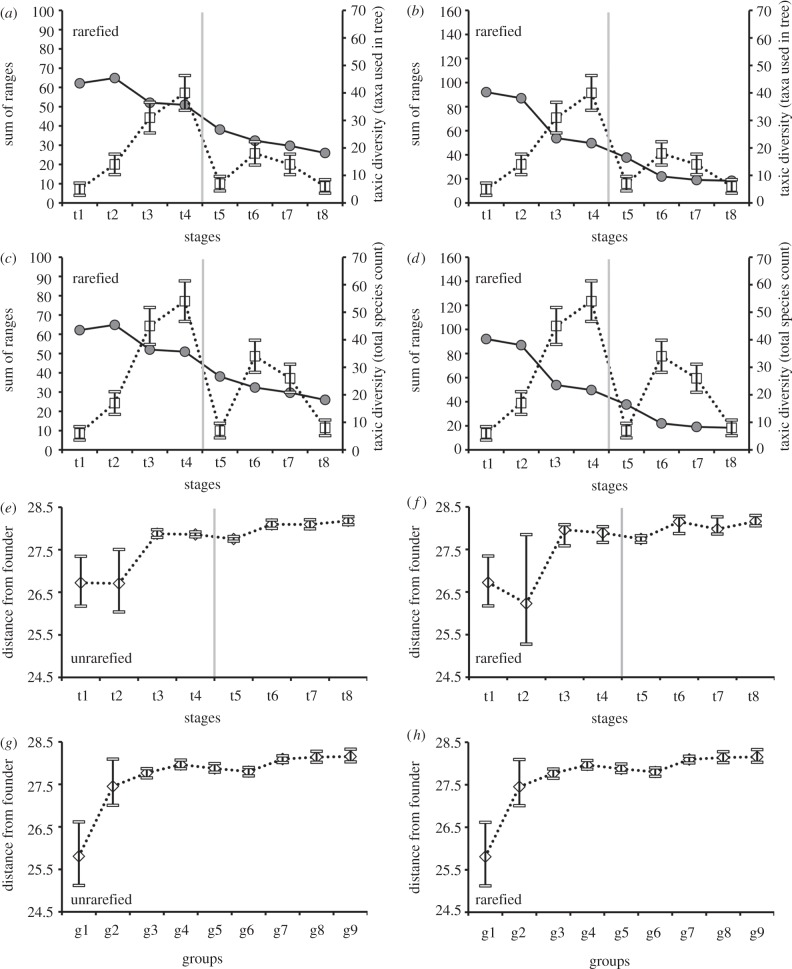
Figure 3.
(a–d) Comparisons between anomodont disparity (rarefied median values, grey circles) and diversity (white squares) through time intervals t1–t8; the disparity values are for the sum of ranges (a,c,e,g) and the sum of variances (b,d,f,h); the error bars around the diversity values are calculated as ±√N, where N is the number of taxa in any given interval; (a,b) comparisons based on the number of taxa present in the phylogeny; (c,d) comparisons based on the total number of known anomodont taxa. (e–h) Distance from the founder (white rhombs), expressed as the average generalized Euclidean distance of taxa from Biseridens (‘founder’ taxon); (e,f) average distance of taxa binned by time intervals; (g,h) average distance of major groups. Vertical grey bars mark the Permian–Triassic boundary.

