
Figure 4.
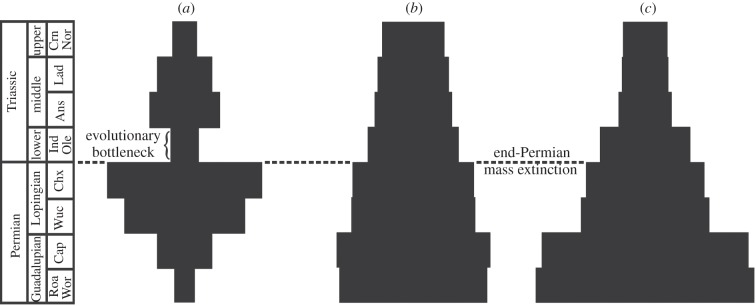
Spindle diagrams highlighting the bottleneck effect of the end-Permian extinction on diversity and disparity. The fine subdivisions of the stratigraphic time scale on the left represent time intervals t1–t8. In each diagram, the widths of the bars are drawn in dimension-less units and proportional to the number of taxa (left diagram) and to the mean disparity values (middle and right diagrams). (a) Diversity counts through time based on the number of taxa present in the phylogeny; (b) rarefied disparity through time using the median value of the sum of ranges and (c) rarefied disparity through time using the median value of the sum of variances.