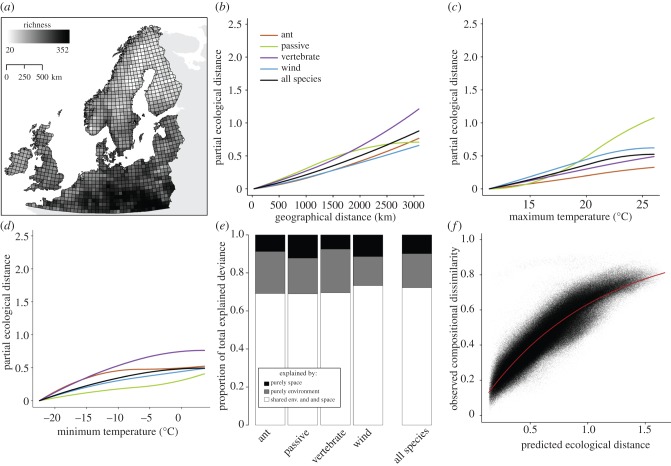
Figure 2.
(a) Variation in species richness in 50 × 50 km cells for the flora of northern Europe. (b–d) Generalized dissimilarity model-fitted I-splines (partial regression fits) for variables significantly associated with plant beta diversity for all four dispersal modes. The maximum height reached by each curve indicates the total amount of compositional turnover associated with that variable (and by extension, the relative importance of that variable in explaining beta diversity), holding all other variables constant. The shape of each function provides an indication of how the rate of compositional turnover varies along the gradient. (e) The proportion of total explained deviance attributable purely to space (black), purely to environment (grey) and jointly to both variables (shared) (white). (f) Relationship between observed compositional dissimilarity of each site pair for the entire flora and the linear predictor of the regression equation from GDM (predicted ecological distance between site pairs).

